Out of Spec - Lots of Good Coverage

I scanned through his whole livestream of the range test. Before getting down to 4% SOC he had to exit/get back up to 70mph a total of 8 times while avoiding rain and construction. In this car, it loses a lot of kW accelerating from standstill to 70mph unless you do it super slow, like I’d guess 1% SOC is lost each time. I think the exits he had to take and then get back up to speed combined with a little battery degradation makes the results make perfect sense that he got “only” 435.5 miles. I think in Tom’s DE R test he only exited once if I remember correctly?
1% to to get up to 70mph from zero sounds pretty excessive. Thats 1.1kwh for just a few seconds of driving.

Worst (least efficient) case would obviously be using max acceleration to get up to speed. Since max power output is 611kw, and duration for 0-70 would would be about 3 seconds (a guess since 0-60 is 2.5) each max acceleration effort would consume 0.509kwh for the motors.

The cooling system would need to consume 100% of the amount of energy that the motors use to get close to 1% per acceleration (I don’t see it possible the cooling system could use an equivalent amount as the motors at full power)

I always skip to the ends of these videos to see the result, but since it’s a range test I assume they don’t use anything near full power for accelerating up to speed, so are never putting close to 611kw down (or taxing the cooling system). Also since each acceleration is due to a preceding deceleration, some of the energy used to accelerate back up to speed is offset by regen (maybe 30% or so?).

I think 8 gentle accelerations combined could account for 1% of battery (accounting for regen offset). I think the difference between OOS and TM range results is really down to the OOS car mileage degradation as you say, and perhaps (not knowing specifics about the TM route) greater elevation change in the OOS route. It’s a very gradual slope but still energy is needed to “lift” the 5,000lb car up 2,000 vertical feet… I may have done something wrong but I’m getting 3.7kwh as energy needed for this (although again, a good portion of this is offset by the outbound downhill leg, and the TM test would certainly not have had zero elevation variance).

Not sure how temperatures compared between the 2 tests. Also even small differences in head/side winds can add up over hours of driving. I guess another factor could be individual variance between cars’ drivetrain efficiencies ( was TM car a press car or borrowed from an owner like the OOS one).

It’s actually testable. Resetting the trip computer a couple miles before taking an uphill on-ramp will reveal the efficiency impact. I’ll try it later. On his trip he had mostly uphill off ramps which helps some because you’re slowing the car down uphill so you get some regen benefit, but any uphill driving in this car burns kW. The elevation changes on the way back on his trip were also uphill, which explains why his mi/kWh was 4.3 for the first 100 miles but then ended up at 4.0.
 
Last edited:
1% to to get up to 70mph from zero sounds pretty excessive. Thats 1.1kwh for just a few seconds of driving.

Worst (least efficient) case would obviously be using max acceleration to get up to speed. Since max power output is 611kw, and duration for 0-70 would would be about 3 seconds (a guess since 0-60 is 2.5) each max acceleration effort would consume 0.509kwh for the motors.

The cooling system would need to consume 100% of the amount of energy that the motors use to get close to 1% per acceleration (I don’t see it possible the cooling system could use an equivalent amount as the motors at full power)

I always skip to the ends of these videos to see the result, but since it’s a range test I assume they don’t use anything near full power for accelerating up to speed, so are never putting close to 611kw down (or taxing the cooling system). Also since each acceleration is due to a preceding deceleration, some of the energy used to accelerate back up to speed is offset by regen (maybe 30% or so?).

I think 8 gentle accelerations combined could account for 1% of battery (accounting for regen offset). I think the difference between OOS and TM range results is really down to the OOS car mileage degradation as you say, and perhaps (not knowing specifics about the TM route) greater elevation change in the OOS route. It’s a very gradual slope but still energy is needed to “lift” the 5,000lb car up 2,000 vertical feet… I may have done something wrong but I’m getting 3.7kwh as energy needed for this (although again, a good portion of this is offset by the outbound downhill leg, and the TM test would certainly not have had zero elevation variance).

Not sure how temperatures compared between the 2 tests. Also even small differences in head/side winds can add up over hours of driving. I guess another factor could be individual variance between cars’ drivetrain efficiencies ( was TM car a press car or borrowed from an owner like the OOS one).
And I definitely may be wrong, what you’re saying makes sense. TM test was at 55-65 degrees, Kyle’s I think a bit warmer. He must have had some side-wind/turbulence from having to do those slow passes of those big trucks. And he didn’t accelerate too aggressively when getting back up to 70.
 
Car and Driver got 410 @75mph on an AGT with 19” wheels. Tom’s Dream when doing the test almost had 6000 miles on it. I think even I was going to get around 380 at 80/85mph on my last road trip which is impressive.

At the end of the day 400+ miles at those speeds is still very impressive. Take the win
 
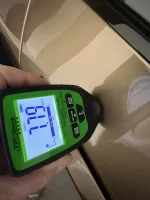
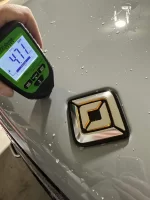
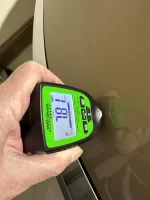
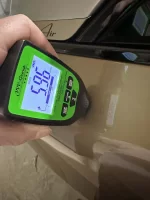
Purchased a paint thickness meter and tested our Eureka Gold. I was surprised to see the Frunk nose readings were in the 7 mils range given all the "thin paint" rumors reported by some. For some reason (sleepy or tired paint robot) the entire passenger side read 2 mils lower but was consistent. I did a couple of quick tests on the Rivian Frunk and it read in the 4 mil range. I was planning to get more readings on the Rivian but I had driven it in the rain and too lazy to have to keep wiping and drying the test surface. I will check the Rivian soon as I did get 3.7mil reading under the passenger side door jus bellow the mirror. I would love to see what other Eureka Gold and Rivian owners have measured
 

Attachments

  • Lucid 12.jpg
    Lucid 12.jpg
    516.4 KB · Views: 89
  • Lucid 8.jpg
    Lucid 8.jpg
    408.7 KB · Views: 94
  • Lucid 5.jpg
    Lucid 5.jpg
    510.7 KB · Views: 87
  • Rivian Frunk.jpg
    Rivian Frunk.jpg
    565.5 KB · Views: 94
Purchased a paint thickness meter and tested our Eureka Gold. I was surprised to see the Frunk nose readings were in the 7 mils range given all the "thin paint" rumors reported by some. For some reason (sleepy or tired paint robot) the entire passenger side read 2 mils lower but was consistent. I did a couple of quick tests on the Rivian Frunk and it read in the 4 mil range. I was planning to get more readings on the Rivian but I had driven it in the rain and too lazy to have to keep wiping and drying the test surface. I will check the Rivian soon as I did get 3.7mil reading under the passenger side door jus bellow the mirror. I would love to see what other Eureka Gold and Rivian owners have measured
Post on Twitter and you’re be told your car is the anomaly and all Lucid’s have shit paint 😂

Maybe that car hit a bad day in the paint shop but even my PPF guy had no complaints on the paint whatsoever.
 
Post on Twitter and you’re be told your car is the anomaly and all Lucid’s have shit paint 😂

Maybe that car hit a bad day in the paint shop but even my PPF guy had no complaints on the paint whatsoever.
HAHhahha yes no doubt. My DEP is number 180. Lucid was building one or two a day back then. Could be an anomaly. Either way I am happy with the results.
 
Let’s be honest and level headed for a minute. Before Kyle posted the detailing video, were any of us running out buying paint meters and using that to draw any conclusions about the quality of any car we’ve ever owned? And is milimeters to metal the sole measure of paint quality? Y’all done lost your damn minds. So far out of everyone who’s had paint correction/ceramic/PPF done, has anyone’s detailer gone down to the metal, or said wow this car is bad I can’t correct it? All we have is a reference point of 1 car. AutoEvolution obviously thinks this is a HUGE FUCKING DEAL but should we?
 
Let’s be honest and level headed for a minute. Before Kyle posted the detailing video, were any of us running out buying paint meters and using that to draw any conclusions about the quality of any car we’ve ever owned? And is milimeters to metal the sole measure of paint quality? Y’all done lost your damn minds. So far out of everyone who’s had paint correction/ceramic/PPF done, has anyone’s detailer gone down to the metal, or said wow this car is bad I can’t correct it? All we have is a reference point of 1 car. AutoEvolution obviously thinks this is a HUGE FUCKING DEAL but should we?
I did it out of curiosity and it was actually lots of fun.
 
Purchased a paint thickness meter and tested our Eureka Gold. I was surprised to see the Frunk nose readings were in the 7 mils range given all the "thin paint" rumors reported by some. For some reason (sleepy or tired paint robot) the entire passenger side read 2 mils lower but was consistent. I did a couple of quick tests on the Rivian Frunk and it read in the 4 mil range. I was planning to get more readings on the Rivian but I had driven it in the rain and too lazy to have to keep wiping and drying the test surface. I will check the Rivian soon as I did get 3.7mil reading under the passenger side door jus bellow the mirror. I would love to see what other Eureka Gold and Rivian owners have measured
Let’s be honest and level headed for a minute. Before Kyle posted the detailing video, were any of us running out buying paint meters and using that to draw any conclusions about the quality of any car we’ve ever owned? And is milimeters to metal the sole measure of paint quality? Y’all done lost your damn minds. So far out of everyone who’s had paint correction/ceramic/PPF done, has anyone’s detailer gone down to the metal, or said wow this car is bad I can’t correct it? All we have is a reference point of 1 car. AutoEvolution obviously thinks this is a HUGE FUCKING DEAL but should we?
This is not a big deal. But I just ordered a paint meter to test all my cars and all friends’ Tesla out of curiosity.

Kyle should have “Please click the link below for paint meter and type in the coupon code ‘out of spec’ promotion.” 🤣
 
Let’s be honest and level headed for a minute. Before Kyle posted the detailing video, were any of us running out buying paint meters and using that to draw any conclusions about the quality of any car we’ve ever owned? And is milimeters to metal the sole measure of paint quality? Y’all done lost your damn minds. So far out of everyone who’s had paint correction/ceramic/PPF done, has anyone’s detailer gone down to the metal, or said wow this car is bad I can’t correct it? All we have is a reference point of 1 car. AutoEvolution obviously thinks this is a HUGE FUCKING DEAL but should we?

Preach!!! My point exactly, @bunnylebowski. It’s done, the car is already painted, we’ve got it in our garage. There’s nothing to be done, but fret over something we have absolutely no control over, and which might have absolutely nothing to do with anything when it comes to overall build quality and longterm enjoyment of our cars.
 
The paint quality on my new Lucid (picked it up end of September) looks absolutely beautiful and has all of the depth and complexity that a Zenith Red should have. Nevertheless, I went over to BEL's house today, in Bellingham, WA, and used his meter. The hood was above 9 mils on all readings, everywhere else the readings were all above 4 mils, with the ecxeption of the areas right next to the side windows, These areas curves away from the more verticle center of the doors. There, the reading were all 3.8 mils. Dispite the naysayers, I am glad I put this issue to rest, at least for my car. And, a big Thank You to BEL. It was great to meet you.
 
Another video here:

As a side note, someone needs to special add Kyle to that 2.0 beta 😅. He’s been feeding a lot of positive coverage and has been fairly holding back on the software criticism in preparation for 2.xx.

I’m not usually on favor of giving bloggers special treatment, but Lucid did send him new rims/tires for performance testing, they should have pushed the new FW as well.
 
I’m not usually on favor of giving bloggers special treatment, but Lucid did send him new rims/tires for performance testing, they should have pushed the new FW as well.
It’s a huge risk. Given that out of just 100 people on our forums who have it, a handful are experiencing some issues already, handing a beta over to someone with millions of followers and a video camera might not be the best idea.
 
It’s a huge risk. Given that out of just 100 people on our forums who have it, a handful are experiencing some issues already, handing a beta over to someone with millions of followers and a video camera might not be the best idea.
He does not have millions of followers. Just over a 100000 subscribers and typical video viewership of less than 40000. There are several reviewers who have way more views. I am not sure why Kyle gets special treatment (he did from Rivian too) since he obviously can afford the vehicles himself (he has over half a million in vehicles).
 
Kyle is a happy-looking person and has a generally informed perspective on each vehicle that he reviews so can be engaging and entertaining. He highlighted a number of items on the AGT such as the front motor mount, for example, that I had not known. The part about the paint thickness from his detailer in another video was interesting, but my detailer had no comments or problems with my paint when he Opticoated my car. Otherwise, it's as the Dude said: "It's like your opinion man." He is obviously subjective with his repeated denigration of the appearance of the 19" wheels and preference for his S Plaid. If he feels better with more BA looking large wheels then be it so. On balance, he was positive about the AGT, but as far as I watched through his recent lengthy BMW 7 Series review, he seems to like that car quite a bit for reasons well beyond my understanding. It is time for Motor Trend and Jonny Lieberman to revisit Lucid Air COTY a year later for some objective perspective from a super well-informed journalist.
 
He does not have millions of followers. Just over a 100000 subscribers and typical video viewership of less than 40000. There are several reviewers who have way more views. I am not sure why Kyle gets special treatment (he did from Rivian too) since he obviously can afford the vehicles himself (he has over half a million in vehicles).
- Kyle is geek that open boxes to dissect and inform.
- Lucid organization is started by engineer nerds looking for perfection in all optimizations.
- Kyle’s viewers come to him to seek nerdy information to make informed purchase decision.

Kyle’s viewers are more hardcore and serious buyer than a lot of 1M+ followers just follow for window shopping. C’mon, how many influencers out there make 1 hours + video keep informing?
Therefore the quality of Kyle followers is more meaningful and relevant than the size of Justin Bieber’s followers.
 
Back
Top