Lucid Air delivers a significant range replenishing advantage over Tesla Model S Plaid, which wins in a few metrics too.

Today we will analyze the fast charging capabilities of the all-new Lucid Air Dream Edition, which was recently tested by our very own Tom Moloughney (see video at the bottom of this post).
The Lucid Air aspires to be the new state-of-the-art EV, with the world's best charging capabilities, so in the second part of this article, we will compare the results directly with the Tesla Model S Plaid's fast charging analysis (specifically, with Tom's test - out of three that we checked).
In the coming days, we would like to make a comparison with a few other models including top Porsche/Audi and Hyundai/Kia models. Stay t for more.
The Lucid Air Dream Edition, with a pre-conditioned battery, was tested at an Electrify America fast-charging station, which is rated at up to 350 kW (compatible with 800 V battery systems).
Let's crunch some numbers!
Charging power vs state-of-charge (SOC)
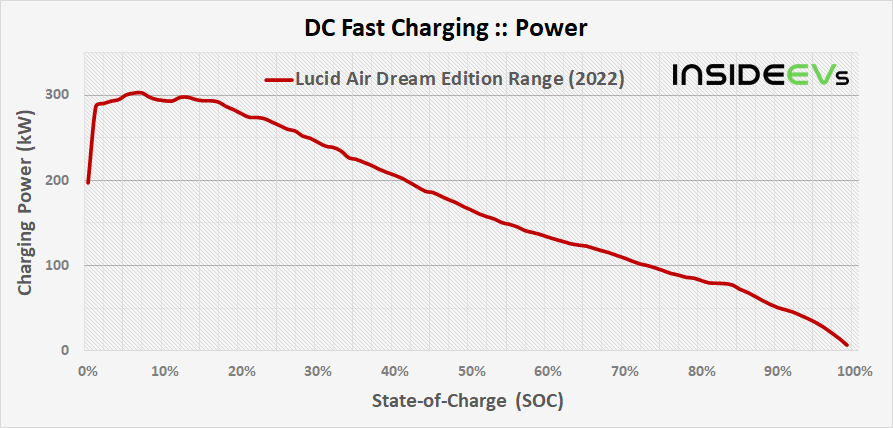
According to the data obtained from the 0-100% SOC test, we can see that the charging power surges almost immediately after the start - exceeding 200 kW within seconds.
The peak charging power was over 302 kW at 6% SOC (for a second we saw even 304 kW) and on average above 300 kW is maintained between 5% to 7%. The highest power window - 290 kW or more was available between 2% and 17% SOC.
After that, charging power decreases more or less smoothly, reaching 200 kW at 41% SOC and 100 kW at 73% SOC.
At 90% SOC, the power was at about 50 kW and decreasing quickly, which means that there is not much value in charging to very high SOC levels.
The total energy delivered to the car (according to the Electrify America charger) was 134 kWh.
State-of-charge (SOC) vs time
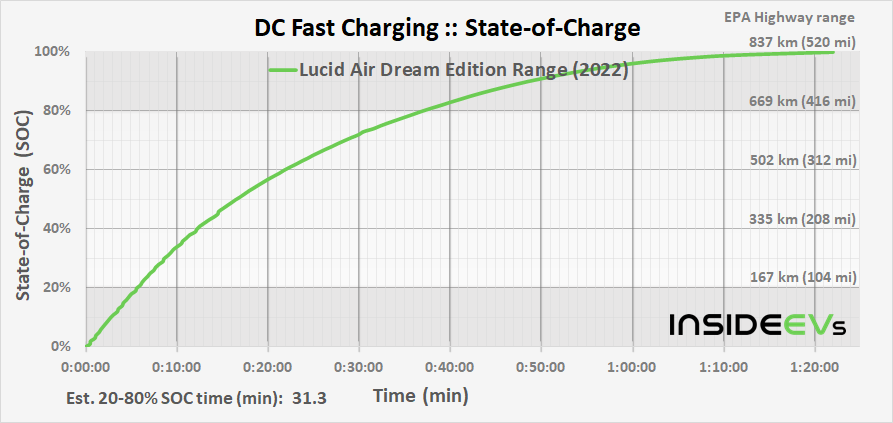
The charging session from 0-100% took 1 hour and 22 minutes, but the more important values are times up to 80%:
Average charging power vs state-of-charge (SOC)
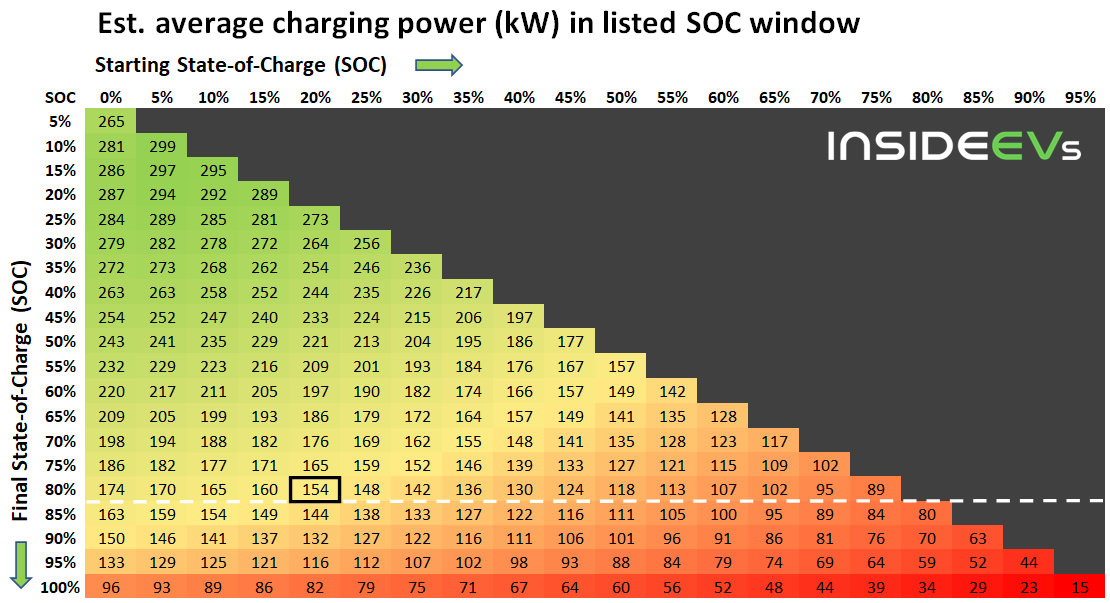
The average power in the very important range from 20% to 80% SOC is 154 kW, which is 51% of the peak value. Between 10% and 80%, the average is 165 kW.
C-rate vs state-of-charge (SOC)
Lucid says that the battery capacity of the Air Dream Edition is 118 kWh, but does not explain the details (usable/total value). For the sake of this article, we assume that it's the usable battery capacity, while the total battery capacity is 122 kWh.
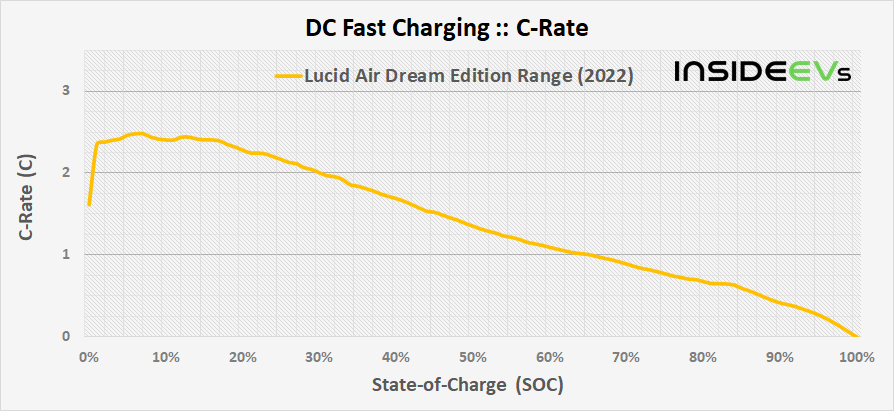
The peak C-rate* - charging power in relation to the total battery capacity of 122 kWh (our guess) - is about 2.5C. The average C-rate when charging from 20% to 80% SOC is 1.3C. Both values are pretty good, but not the highest that we have seen.
*C-rate tells us how the charging power relates to the battery pack capacity. For example: 1C is 1-hour charging power (current), when the power value in kW is equal to the battery pack capacity in kWh. 2C would be enough to recharge in half an hour.
The net battery capacity of 118 kWh stands for about 96.7% of the total battery capacity.
Range replenishing speed vs state-of-charge (SOC)
The rate of range replenishing depends on the energy consumption and the energy consumption depends on the use case.
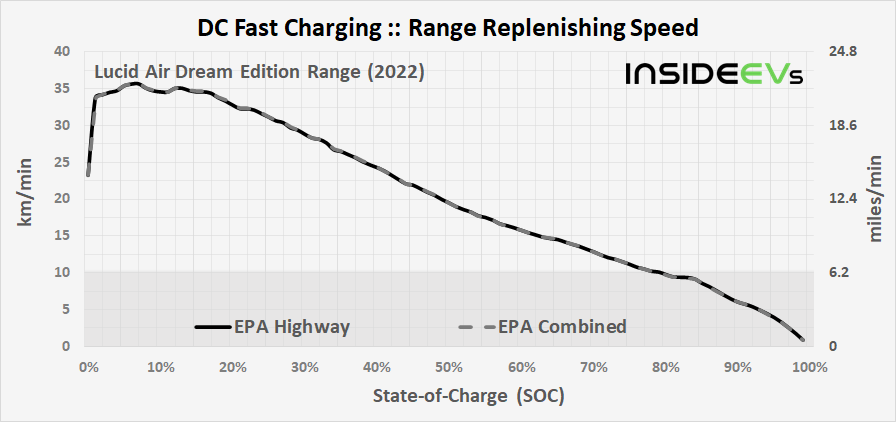
In the case of the Lucid Air, at the moment we have only EPA ratings, and we will use the range values for the 19" wheel version (the base case scenario) - 520 miles.
Those are outstanding results that might be considered the best ever. In perfect conditions and optimum SOC window, one can replenish 100 km (62 miles) of range in just 3 minutes.
Ultimate DC fast charging card
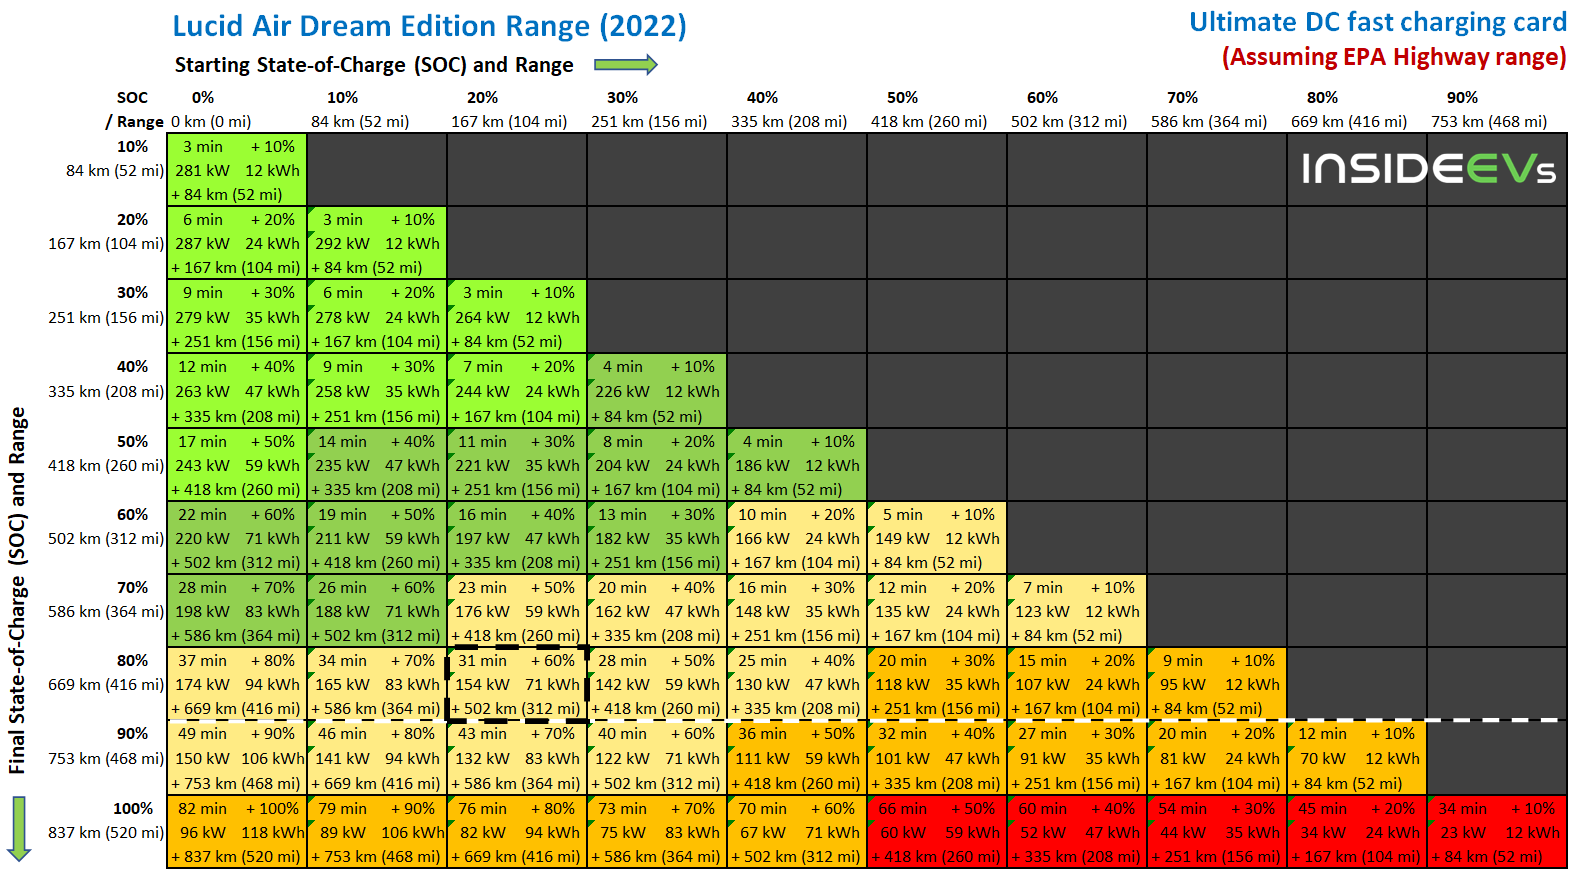
Here is our ultimate charging card for the Lucid Air Dream Edition Range 19" (2022) that shows an estimated time of charging to add a certain number of SOC percent points, average charging power, added energy and added range for listed SOC ranges. Click here to enlarge the image.
The matrix above, might be helpful from the user perspective, but be aware that it's just an estimate from a particular test, with measure and calculation uncertainty probably above 5%. On top of that comes variation for individual case - car (version, age/battery state-of-health), charger, ambient and battery temperature, software version and more (including cabin heating/cooling during charging). Another thing is that the charging curve might shift when charging starts at a lower/higher SOC.
Now it's time to compare the Lucid Air with the Tesla Model S Plaid Supercharging test:
If we take a look at the raw charging curves, it turns out that the two cars are much closer than one would think.
Lucid Air starts more aggressively and reaches higher levels of roughly 300 kW, while the Tesla Model S was capped at 250 kW (the maximum value of the V3 Superchargers). Tesla has also a smaller battery.
What we can note is a very similar approach to charging: reach a maximum rate initially and then gradually lower it, as required.
It's interesting that the Tesla Model S with a re-designed battery pack (still with 1865-type cylindrical cells) delivers comparable results (especially after 30% SOC) to the all-new Lucid Air (with 2170-type cylindrical cells and a noticeably bigger pack). The initial difference is also related to the maximum output from the Supercharger.
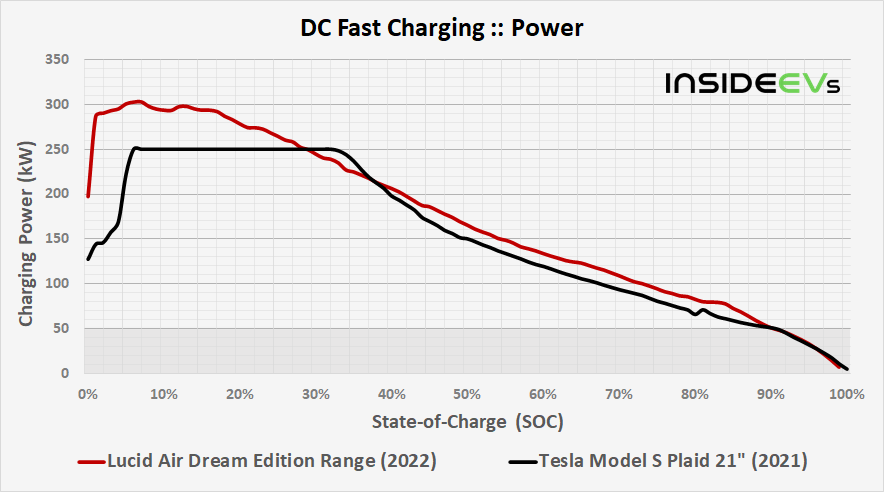
The average power level in the popular 20-80% SOC window is 154 kW (Lucid Air) vs 139 kW (Tesla Model S). Between 10 and 80% SOC it would be respectively 165 kW vs 149 kW. Not that much of a difference.
Comparison of State-of-charge (SOC) vs time
Here is another surprise. Time-wise, the Tesla Model S actually achieves 80% SOC faster than the Lucid Air: 25 minutes to 31 minutes.
It's not intuitive, but that is because of the difference in the battery capacity - Lucid charges at higher power but has also more energy to recharge.
*The starting points were adjusted to the lowest common SOC.
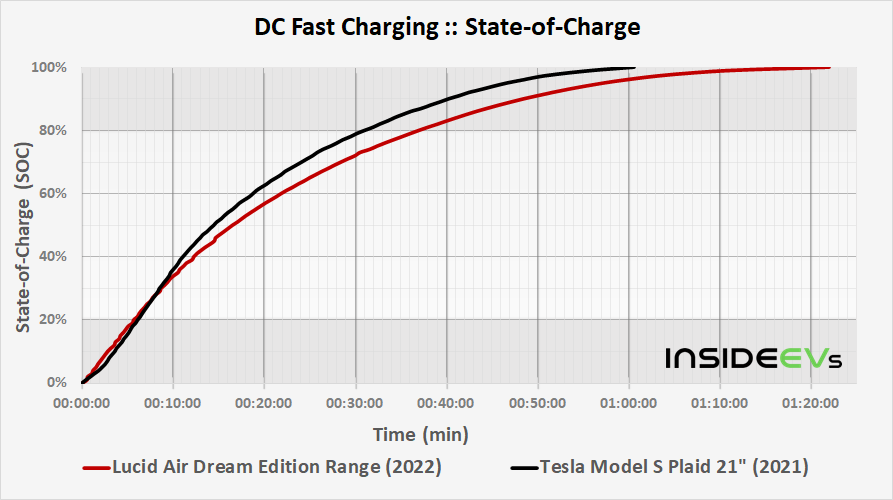
In the 10-80% SOC window, the Tesla Model S needs 27.5 minutes, while the Lucid Air is over 34 minutes.
A quick look at the table:
Comparison of C-rate
Finally, the C-rate comparison, which reveals to us what is going on. Tesla has a very good C-rate, which means that it charges faster than Lucid, considering the battery capacity (more kW per kWh). And it's true for the majority of the charging curve.
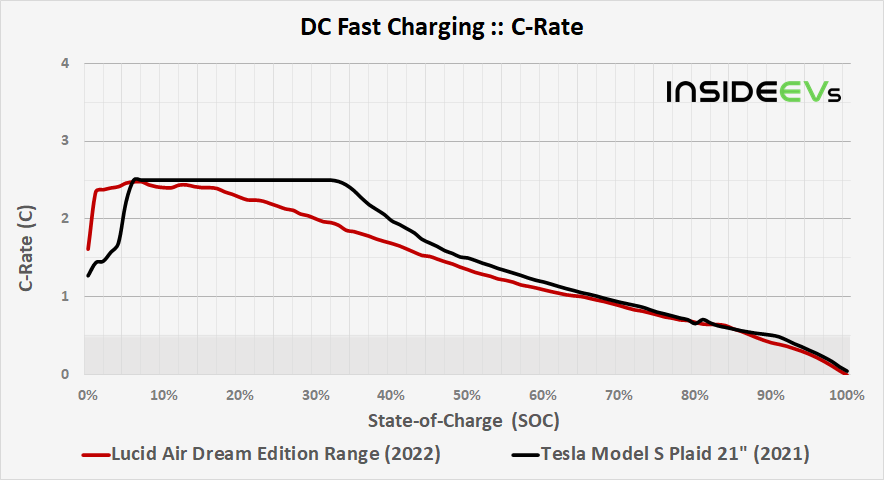
The Tesla Model S has a similar peak (2.5C), but is available longer and the 20-80% SOC result is slightly better (1.4C vs 1.3C).
Comparison of range replenishing speed
Now, the most important metric from a consumer perspective - the range replenishing rate. We will use the EPA Highway range as a base (the only available common rating for the two).
To be fair, we will check the range replenishing rate for the Lucid Air Dream Edition Range with 19" wheels and the Tesla Model S Long Range with 19" wheels (the Plaid with 21" wheels is also there for reference). The Model S LR 19" has 387.7 miles of EPA Highway range (405 miles EPA Combined).
The chart reveals that the Lucid Air has a significant advantage over the Tesla Model S. It's slightly more efficient and additionally charges at higher power (more kW). The combined effect of those two factors is more miles replenished per time unit.
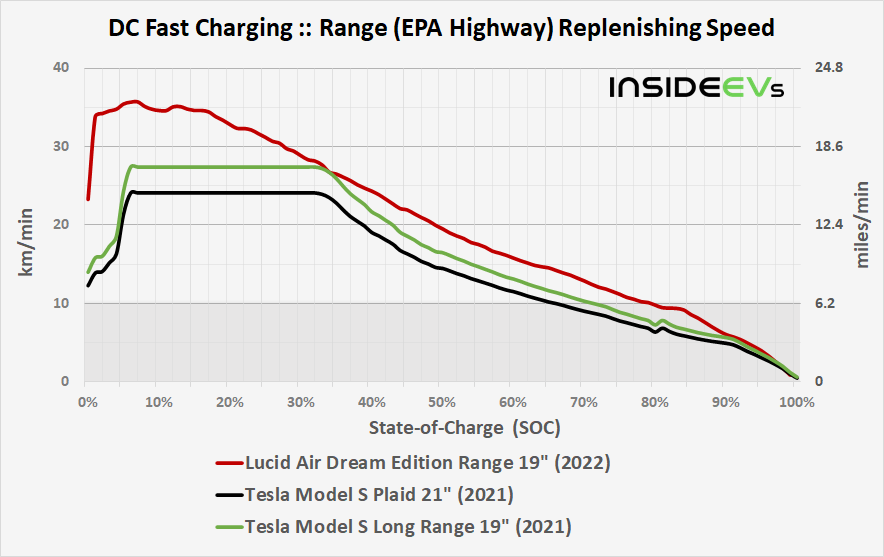
The Lucid Air's average in 20-80% SOC window is 18.2 km/min (11.3 mi/min), compared to 15.2 km/min (9.5 mi/min) in the case of the Tesla Model S LR.
It means that the Lucid Air replenishes range some 20% quicker. Because it has a bigger battery, one can also stay longer, and replenish more range to reach a further destination.
Conclusions
The conclusion from the DC fast charging test of the 2022 Lucid Air Dream Edition Range is that it's most likely the fastest charging electric car on the market.
The peak power is roughly 300 kW, but the average in the 20-80% SOC window is 154 kW (not as fast as some expected). If you are in a hurry, it might be better to arrive at the charging station with a low SOC (10-20%) and leave earlier, rather than charge up to 80%.
It takes 31 minutes to recharge from 20% to 80% SOC, but at low SOC, the first 100 miles can be replenished in just several minutes.
We guess that there might be a potential for further improvements, as the C-rate is not the highest.
In comparison with the refreshed Tesla Model S, we noted that there is a big advantage in terms of range replenishing speed.
However, the Tesla Model S appears to be a very strong contender. Its battery charges at a higher C-rate (higher power compared to the total capacity). Not only that, the charging power is comparable between 30% and 100% SOC, with only a small advantage for the Lucid Air, which is equipped with a bigger battery. It's an engineering masterpiece, especially since Tesla still uses the 1865-type cylindrical format.
Another thing is that the Tesla Model S reaches certain state-of-charge (SOC) levels faster because it has a smaller battery.
Those are interesting findings because many thought that Lucid Air would win by a fair margin in all metrics. However, most of its advantage comes from having a bigger battery (more kWh), rather than efficiency (it has its important part too, of course), and that the V3 Superchargers are capped at 250 kW.
General info:
* Some values on the charts are estimated from the data source.
** Temperature of the battery cells might highly negatively affect charging capabilities. We don't have data about temperatures of the battery at the beginning and during the charging process. In cold or hot weather, as well as after driving very dynamically, charging power might be significantly lower than shown on the charts (in extreme cases charging might be impossible until the battery temperature will not return to an acceptable level).
https://insideevs.com/info/team/mark-kane/
Source: https://insideevs.com/news/555634/lucid-air-fast-charging-analysis/
The Lucid Air aspires to be the new state-of-the-art EV, with the world's best charging capabilities, so in the second part of this article, we will compare the results directly with the Tesla Model S Plaid's fast charging analysis (specifically, with Tom's test - out of three that we checked).
In the coming days, we would like to make a comparison with a few other models including top Porsche/Audi and Hyundai/Kia models. Stay t for more.
The Lucid Air Dream Edition, with a pre-conditioned battery, was tested at an Electrify America fast-charging station, which is rated at up to 350 kW (compatible with 800 V battery systems).
Let's crunch some numbers!
Charging power vs state-of-charge (SOC)
According to the data obtained from the 0-100% SOC test, we can see that the charging power surges almost immediately after the start - exceeding 200 kW within seconds.
The peak charging power was over 302 kW at 6% SOC (for a second we saw even 304 kW) and on average above 300 kW is maintained between 5% to 7%. The highest power window - 290 kW or more was available between 2% and 17% SOC.
After that, charging power decreases more or less smoothly, reaching 200 kW at 41% SOC and 100 kW at 73% SOC.
At 90% SOC, the power was at about 50 kW and decreasing quickly, which means that there is not much value in charging to very high SOC levels.
The total energy delivered to the car (according to the Electrify America charger) was 134 kWh.

The charging session from 0-100% took 1 hour and 22 minutes, but the more important values are times up to 80%:
- 10-80%: 34.2 minutes
- 20-80%: 31.3 minutes
- 10-90%: 45.7 minutes
- 20-90%: 42.9 minutes

The average power in the very important range from 20% to 80% SOC is 154 kW, which is 51% of the peak value. Between 10% and 80%, the average is 165 kW.

Lucid says that the battery capacity of the Air Dream Edition is 118 kWh, but does not explain the details (usable/total value). For the sake of this article, we assume that it's the usable battery capacity, while the total battery capacity is 122 kWh.
The peak C-rate* - charging power in relation to the total battery capacity of 122 kWh (our guess) - is about 2.5C. The average C-rate when charging from 20% to 80% SOC is 1.3C. Both values are pretty good, but not the highest that we have seen.
*C-rate tells us how the charging power relates to the battery pack capacity. For example: 1C is 1-hour charging power (current), when the power value in kW is equal to the battery pack capacity in kWh. 2C would be enough to recharge in half an hour.
The net battery capacity of 118 kWh stands for about 96.7% of the total battery capacity.

The rate of range replenishing depends on the energy consumption and the energy consumption depends on the use case.
In the case of the Lucid Air, at the moment we have only EPA ratings, and we will use the range values for the 19" wheel version (the base case scenario) - 520 miles.
- EPA Combined range
Taking into consideration the EPA Combined range of 520 miles (837 km) and available battery capacity of 118 kWh, we can assume energy consumption of 227 Wh/mile (141 Wh/km).
The effective average speed of range replenishing when charging from 20% to 80% SOC would be then 11.3 miles/minute (18.2 km/minute). - EPA Highway range
Taking into consideration the EPA Highway range of 520 miles (837 km) and available battery capacity of 118 kWh, we can assume energy consumption of 227 Wh/mile (141 Wh/km).
The effective average speed of range replenishing when charging from 20% to 80% SOC would be then 11.3 miles/minute (18.2 km/minute).
Those are outstanding results that might be considered the best ever. In perfect conditions and optimum SOC window, one can replenish 100 km (62 miles) of range in just 3 minutes.

Here is our ultimate charging card for the Lucid Air Dream Edition Range 19" (2022) that shows an estimated time of charging to add a certain number of SOC percent points, average charging power, added energy and added range for listed SOC ranges. Click here to enlarge the image.

Now it's time to compare the Lucid Air with the Tesla Model S Plaid Supercharging test:
- Lucid Air Dream Edition Range - Tom Moloughney's test (November 2022)
- Tesla Model S Plaid 21" V3 Supercharging - Tom Moloughney's test (October 2021)
at 80% SOC, the session was interrupted and required a quick re-connection (see the bump on the black line), but it has a marginal influence on the result
If we take a look at the raw charging curves, it turns out that the two cars are much closer than one would think.
Lucid Air starts more aggressively and reaches higher levels of roughly 300 kW, while the Tesla Model S was capped at 250 kW (the maximum value of the V3 Superchargers). Tesla has also a smaller battery.
What we can note is a very similar approach to charging: reach a maximum rate initially and then gradually lower it, as required.
It's interesting that the Tesla Model S with a re-designed battery pack (still with 1865-type cylindrical cells) delivers comparable results (especially after 30% SOC) to the all-new Lucid Air (with 2170-type cylindrical cells and a noticeably bigger pack). The initial difference is also related to the maximum output from the Supercharger.

| DC Fast Charging Comparison by InsideEVs | |||
| Model [data source] | Drive / Battery (kWh) | Max Power | Avg Power (20-80%) |
| 2022 Lucid Air Dream Edition Range [Tom Moloughney] | AWD 122 kWh | 302 kW | 154 kW |
| 2021 Tesla Model S Plaid 21" (V3 SC) [Tom Moloughney] | AWD 100 kWh | 250 kW | 139 kW |
Comparison of State-of-charge (SOC) vs time
Here is another surprise. Time-wise, the Tesla Model S actually achieves 80% SOC faster than the Lucid Air: 25 minutes to 31 minutes.
It's not intuitive, but that is because of the difference in the battery capacity - Lucid charges at higher power but has also more energy to recharge.
*The starting points were adjusted to the lowest common SOC.

A quick look at the table:
| DC Fast Charging Comparison by InsideEVs | ||||
| Model [data source] | Drive / Battery (kWh) | Max Power | Avg Power (20-80%) | Time (20-80%) |
| 2022 Lucid Air Dream Edition Range [Tom Moloughney] | AWD 122 kWh | 302 kW | 154 kW | 31 min |
| 2021 Tesla Model S Plaid 21" (V3 SC) [Tom Moloughney] | AWD 100 kWh | 250 kW | 139 kW | 25 min |
Comparison of C-rate
Finally, the C-rate comparison, which reveals to us what is going on. Tesla has a very good C-rate, which means that it charges faster than Lucid, considering the battery capacity (more kW per kWh). And it's true for the majority of the charging curve.

| DC Fast Charging Comparison by InsideEVs | |||||
| Model [data source] | Drive / Battery (kWh) | Max Power | Avg Power (20-80%) | Max C-Rate | Avg C-Rate (20-80%) |
| 2022 Lucid Air Dream Edition Range [Tom Moloughney] | AWD 122 kWh | 302 kW | 154 kW | 2.5 | 1.3 |
| 2021 Tesla Model S Plaid 21" (V3 SC) [Tom Moloughney] | AWD 100 kWh | 250 kW | 139 kW | 2.5 | 1.4 |
Comparison of range replenishing speed
Now, the most important metric from a consumer perspective - the range replenishing rate. We will use the EPA Highway range as a base (the only available common rating for the two).
To be fair, we will check the range replenishing rate for the Lucid Air Dream Edition Range with 19" wheels and the Tesla Model S Long Range with 19" wheels (the Plaid with 21" wheels is also there for reference). The Model S LR 19" has 387.7 miles of EPA Highway range (405 miles EPA Combined).
The chart reveals that the Lucid Air has a significant advantage over the Tesla Model S. It's slightly more efficient and additionally charges at higher power (more kW). The combined effect of those two factors is more miles replenished per time unit.

It means that the Lucid Air replenishes range some 20% quicker. Because it has a bigger battery, one can also stay longer, and replenish more range to reach a further destination.
| DC Fast Charging Comparison by InsideEVs | ||||
| Model [data source] | Drive / Battery (kWh) | Avg Power (20-80%) | EPA Hgw range rep. rate (20-80%) | IEVs 70mph range rep. rate (20-80%) |
| 2022 Lucid Air Dream Edition Range 19" [Tom Moloughney] | AWD 122 kWh | 154 kW | 18.2 km/min (11.3 mi/min) | |
| 2021 Tesla Model S Plaid 21" (V3 SC) [Tom Moloughney] | AWD 100 kWh | 139 kW | 13.4 km/min (8.3 mi/min) | 11.8 km/min (7.3 mi/min) |
| 2021 Tesla Model S LR 19" (V3 SC) | AWD 100 kWh | 139 kW | 15.2 km/min (9.5 mi/min) |
Conclusions
The conclusion from the DC fast charging test of the 2022 Lucid Air Dream Edition Range is that it's most likely the fastest charging electric car on the market.
The peak power is roughly 300 kW, but the average in the 20-80% SOC window is 154 kW (not as fast as some expected). If you are in a hurry, it might be better to arrive at the charging station with a low SOC (10-20%) and leave earlier, rather than charge up to 80%.
It takes 31 minutes to recharge from 20% to 80% SOC, but at low SOC, the first 100 miles can be replenished in just several minutes.
We guess that there might be a potential for further improvements, as the C-rate is not the highest.
| 2022 Lucid Air Dream Edition Range 19" :: DC Fast Charging Summary by InsideEVs Drive: AWD; Battery pack (net / total): 118 / 122 kWh [Data source: Tom Moloughney] | |
| Peak Power Peak C-rate Average Power (20-80% SOC) Average-to-Peak Power Average C-rate (20-80% SOC) Time (20-80% SOC) | 302 kW 2.5 154 kW 50% 1.3 31 min |
| Range Replenishing Speed (Average 20-80% SOC): | |
| EPA Combined EPA Highway | 18.2 km/min (11.3 mi/min) 18.2 km/min (11.3 mi/min) |
However, the Tesla Model S appears to be a very strong contender. Its battery charges at a higher C-rate (higher power compared to the total capacity). Not only that, the charging power is comparable between 30% and 100% SOC, with only a small advantage for the Lucid Air, which is equipped with a bigger battery. It's an engineering masterpiece, especially since Tesla still uses the 1865-type cylindrical format.
Another thing is that the Tesla Model S reaches certain state-of-charge (SOC) levels faster because it has a smaller battery.
Those are interesting findings because many thought that Lucid Air would win by a fair margin in all metrics. However, most of its advantage comes from having a bigger battery (more kWh), rather than efficiency (it has its important part too, of course), and that the V3 Superchargers are capped at 250 kW.
General info:
* Some values on the charts are estimated from the data source.
** Temperature of the battery cells might highly negatively affect charging capabilities. We don't have data about temperatures of the battery at the beginning and during the charging process. In cold or hot weather, as well as after driving very dynamically, charging power might be significantly lower than shown on the charts (in extreme cases charging might be impossible until the battery temperature will not return to an acceptable level).
Source: https://insideevs.com/news/555634/lucid-air-fast-charging-analysis/
