
I've owned my 2026 Lucid Gravity Grand Touring since August 2025, and I recently decided to conduct a detailed real-world range experiment.
I've previously performed similar full-battery range tests on my first-generation Rivian R1S (Quad-Motor Large Pack), so I wanted to compare my Gravity's actual performance against its EPA rating, its reported efficiency, and my previous ownership experience.
The results were disappointing, but what interests me even more is the discrepancy between the energy Lucid reports consuming, the percentage of battery depleted, and the energy subsequently required to recharge the vehicle.
I'm sharing all the measurements so other owners can compare their experiences, identify anything I might be overlooking, and hopefully help clarify how Lucid calculates battery energy consumption. This is going to be a long post, similar to a OOS Video. What can I say, I am a numbers guy. Anyways, be warned and enjoy!
The vehicle was running its existing tires, and I did not change the wheel or tire configuration during the experiment.
One disclosure worth making: I do not currently have the aerodynamic inserts installed on my 21/22-inch wheels. I recognize they may improve efficiency, particularly at higher speeds, although I would not expect their absence to account for the entire range difference observed here.
Test ended: October 16, 2026, approximately 9 PM
Elapsed time: Approximately 9 days and 13½ hours
I began with the battery at 100% and drove the vehicle normally throughout my daily commutes and errands in South Florida without recharging.
My objective was to maximize efficiency while still using the vehicle for everyday transportation.
Conditions and driving behavior:
However, it was a relatively favorable driving environment for an EV, particularly given the limited highway mileage.
For context, the EPA combined rating weights city and highway results approximately 55% and 45%, respectively, after applying its prescribed adjustments. My test involved substantially less highway driving.
I also recognize that EPA highway cycles aren't equivalent to driving continuously at 75 mph, and a predominantly suburban test isn't automatically more efficient than an EPA cycle. Nevertheless, I would have expected my driving pattern to give the Gravity a reasonable opportunity to approach its advertised range.
The 3.23 mi/kWh display is internally consistent with the reported driving energy:
327.8 miles ÷ 101.4 kWh = 3.23 mi/kWh.
However, extrapolating actual distance against the battery percentage consumed gives a different picture:
327.8 miles ÷ 0.963 = 340.4 miles of projected full-battery range.
That extrapolation assumes the remaining battery percentage would provide approximately the same miles per percentage point as the preceding 96.3%. It is not an independently measured 0%-to-100% usable range.
In other words, the vehicle was on pace to deliver approximately 88.2% of its advertised EPA range.
I am not suggesting the EPA rating guarantees 386 miles in every circumstance. I understand how much EV range can fluctuate.
What disappoints me is that this result occurred despite driving conservatively, in warm weather, with relatively little high-speed highway use.
Lucid reports:
120 × 0.944 = 113.28 kWh.
But the trip computer reports only 101.4 kWh.
That's a difference of approximately 11.9 kWh attributable to the driving period, before considering the separate parked consumption.
If we include all battery depletion:
120 × 0.963 = 115.56 kWh.
Dividing that by the actual distance traveled:
327.8 ÷ 115.56 = 2.84 mi/kWh overall.
That's materially different from the 3.23 mi/kWh displayed by the trip computer.
I fully appreciate that these calculations depend on assuming 120 kWh usable capacity, and that the SOC readout may not be perfectly linear with energy.
I also suspect the two screens may use different accounting boundaries. For example, perhaps the trip computer excludes certain thermal-management loads or other energy consumed while the vehicle is operating.
If so, I'd like to understand exactly which loads are excluded.
My question is not simply whether the battery contains 120 kWh. It's why the vehicle's reported driving efficiency and battery depletion lead to substantially different conclusions about real-world efficiency.
This charger is connected to the Tesla app and reports electrical energy delivered.
I also documented Lucid's own charging display.
The Wall Connector had not been used for another vehicle during this measurement period, so its monthly energy total relates to this recharge.
There was one complication: the Lucid notifications indicate the charging process stopped at approximately 1:17 AM and restarted around 1:24 AM. Tesla's session history consequently displayed a separate later session totaling 77.3 kWh.
I retained screenshots of the cumulative Wall Connector energy readings, including 110.8 kWh earlier in the morning and 124.1 kWh shortly before completion. The 124.1 kWh reading was recorded at 98% SOC; I don't have a separately verified final Wall Connector total after the vehicle reached 100%.
Importantly, the notifications establish that the session was interrupted, but they do not establish whether the cause was the vehicle, charging equipment, adapter, or scheduling behavior.
If that means energy actually stored in the battery, a simple calculation suggests:
112 kWh ÷ 0.97 = 115.5 kWh of implied usable capacity.
But that is conditional on two things:
Similarly, comparing Lucid's 112 kWh against Tesla's preliminary 124.1 kWh gives a ratio of about 90.2%.
That seems plausible for AC charging, but I would not call it a definitive charging-efficiency measurement because the final Tesla total is not yet separately verified and the two manufacturers may measure energy differently.
Nevertheless, the recharge data suggest my vehicle may have more available battery energy than the 101.4 kWh displayed on the driving trip computer would initially imply.
That makes understanding the definitions of these energy counters particularly important.
I performed two similar real-world range experiments with that vehicle in 2023.
Both were multi-day tests using normal commuting and errands.
My Rivian was equipped with 20-inch wheels on smaller all-season tires, the standard size 33" ties.
Rivian's Conserve mode operates primarily using the front motors, which undoubtedly helped its efficiency.
I'm not claiming these are identical or controlled tests. Different vehicles, weather conditions, tire characteristics, and driving patterns can affect the outcomes. Also, manufacturers may calculate displayed efficiency using different methods.
Nevertheless, I find the outcome striking.
My 2023 R1S achieved 343.3 miles in Conserve mode, compared with the Gravity's projected 340.4 miles, despite the Gravity's substantially more aerodynamic design and more advanced electrical architecture.
I also recall the Rivian losing approximately 1% of battery SOC during many overnight parking periods.
By comparison, the Gravity reported only 1.9% parked consumption across the entire nine-and-a-half-day experiment.
That's a genuine positive for Lucid's battery management.
But it makes the ultimate comparison more interesting, because the Gravity enjoyed significantly lower parked consumption during a similarly lengthy test.
I would also love to see Lucid provide a detailed charging-energy breakdown like the one my Rivian offered years ago, showing energy supplied to the battery, battery and cabin conditioning, and accessories.
Even the approximately 340 miles my test projects is more than sufficient for how I use the vehicle.
My interest here is understanding the engineering and verifying how the vehicle performs against its specifications.
Lucid has built its reputation around powertrain efficiency, advanced battery technology, and engineering excellence. Those are precisely the areas where I would expect particularly clear and consistent energy reporting.
I find it disappointing that a 386-mile-rated vehicle, driven gently in a predominantly suburban environment, projected only approximately 340 miles.
But I'm also genuinely interested in understanding why.
The vehicle may be operating entirely as designed, with the discrepancy explained by definitions of usable capacity, auxiliary consumption, and trip-energy accounting.
Alternatively, there may be something about my particular vehicle or its energy reporting that warrants investigation.
I'm not claiming to have demonstrated a battery defect, missing capacity, or an incorrect EPA certification. I'm presenting the measurements and asking how they reconcile.
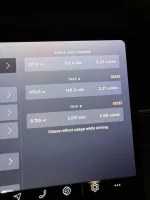
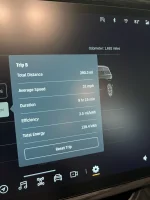
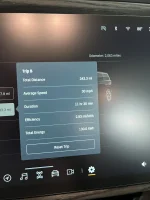
I have screenshots documenting the test progression, final trip statistics, battery-consumption breakdown, charging results, and Wall Connector energy readings. I use Trip A for my month to month numbers so I reset at the first of the month. Trip B is my lifetime numbers.
I'd especially appreciate input from Lucid engineers, other Gravity owners who have performed similar tests, or anyone with detailed knowledge of Lucid's battery and energy-reporting architecture.
Hopefully, this information helps other owners better understand their vehicles as well.
Thanks for reading!
I've previously performed similar full-battery range tests on my first-generation Rivian R1S (Quad-Motor Large Pack), so I wanted to compare my Gravity's actual performance against its EPA rating, its reported efficiency, and my previous ownership experience.
The results were disappointing, but what interests me even more is the discrepancy between the energy Lucid reports consuming, the percentage of battery depleted, and the energy subsequently required to recharge the vehicle.
I'm sharing all the measurements so other owners can compare their experiences, identify anything I might be overlooking, and hopefully help clarify how Lucid calculates battery energy consumption. This is going to be a long post, similar to a OOS Video. What can I say, I am a numbers guy. Anyways, be warned and enjoy!
1. Vehicle specifications
| Specification | My Gravity |
|---|---|
| Model | 2026 Lucid Gravity Grand Touring |
| Seating configuration | Seven passengers |
| Drivetrain | Dual-motor AWD |
| Wheel configuration | 21" front / 22" rear |
| Aerodynamic wheel inserts | Removed during test |
| Published battery capacity | 123 kWh |
| Assumed usable capacity | Approximately 118–120 kWh, not independently verified |
| Official EPA range | 386 miles |
| Odometer at test completion | Approximately 8,755 miles |
One disclosure worth making: I do not currently have the aerodynamic inserts installed on my 21/22-inch wheels. I recognize they may improve efficiency, particularly at higher speeds, although I would not expect their absence to account for the entire range difference observed here.
2. Test methodology and driving conditions
Test started: October 7, 2026, approximately 7:30 AMTest ended: October 16, 2026, approximately 9 PM
Elapsed time: Approximately 9 days and 13½ hours
I began with the battery at 100% and drove the vehicle normally throughout my daily commutes and errands in South Florida without recharging.
My objective was to maximize efficiency while still using the vehicle for everyday transportation.
Conditions and driving behavior:
- Approximately 90% suburban/local roads and 10% highway driving.
- Most local roads had posted speed limits of 35, 45, or 50 mph.
- Highway speeds were kept at approximately 72 mph or below.
- Gentle acceleration and anticipation of upcoming traffic signals.
- Minimal unnecessary braking or aggressive acceleration.
- Warm South Florida conditions, without winter temperatures or substantial elevation changes.
- Normal climate-control and accessory use.
- Multiple overnight parking periods, with parked consumption tracked by the vehicle.
However, it was a relatively favorable driving environment for an EV, particularly given the limited highway mileage.
For context, the EPA combined rating weights city and highway results approximately 55% and 45%, respectively, after applying its prescribed adjustments. My test involved substantially less highway driving.
I also recognize that EPA highway cycles aren't equivalent to driving continuously at 75 mph, and a predominantly suburban test isn't automatically more efficient than an EPA cycle. Nevertheless, I would have expected my driving pattern to give the Gravity a reasonable opportunity to approach its advertised range.
3. Final range test results
I ended the test at 3% battery rather than risking taking the vehicle to displayed 0%.| Measurement | Recorded result |
|---|---|
| Starting state of charge | 100% |
| Ending state of charge | 3% displayed |
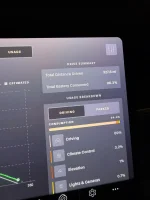
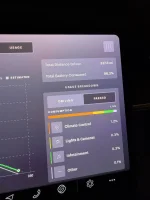
| Total battery consumed, according to usage screen | 96.3% |
| Actual distance traveled | 327.8 miles |
| Driving energy reported by trip computer | 101.4 kWh |
| Displayed driving efficiency | 3.23 mi/kWh |
| Driving-related battery consumption | 94.4% |
| Parked battery consumption | 1.9% |
327.8 miles ÷ 101.4 kWh = 3.23 mi/kWh.
However, extrapolating actual distance against the battery percentage consumed gives a different picture:
327.8 miles ÷ 0.963 = 340.4 miles of projected full-battery range.
That extrapolation assumes the remaining battery percentage would provide approximately the same miles per percentage point as the preceding 96.3%. It is not an independently measured 0%-to-100% usable range.
Actual performance versus EPA
| Measurement | Miles |
|---|---|
| Official EPA rating | 386.0 |
| Actual distance driven to 3% | 327.8 |
| Projected full-battery range | 340.4 |
| Projected shortfall against EPA | 45.6 |
| Percentage below EPA | 11.8% |
I am not suggesting the EPA rating guarantees 386 miles in every circumstance. I understand how much EV range can fluctuate.
What disappoints me is that this result occurred despite driving conservatively, in warm weather, with relatively little high-speed highway use.
4. The energy-accounting question: Where is the difference?
This is the part I would particularly appreciate technical input on.Lucid reports:
- 101.4 kWh consumed while driving.
- 94.4% battery consumption attributed to driving-related activity.
- 1.9% battery consumption while parked.
- 96.3% total battery consumption.
120 × 0.944 = 113.28 kWh.
But the trip computer reports only 101.4 kWh.
That's a difference of approximately 11.9 kWh attributable to the driving period, before considering the separate parked consumption.
If we include all battery depletion:
120 × 0.963 = 115.56 kWh.
Dividing that by the actual distance traveled:
327.8 ÷ 115.56 = 2.84 mi/kWh overall.
That's materially different from the 3.23 mi/kWh displayed by the trip computer.
I fully appreciate that these calculations depend on assuming 120 kWh usable capacity, and that the SOC readout may not be perfectly linear with energy.
I also suspect the two screens may use different accounting boundaries. For example, perhaps the trip computer excludes certain thermal-management loads or other energy consumed while the vehicle is operating.
If so, I'd like to understand exactly which loads are excluded.
My question is not simply whether the battery contains 120 kWh. It's why the vehicle's reported driving efficiency and battery depletion lead to substantially different conclusions about real-world efficiency.
5. I recharged from 3% to 100% and independently tracked the electricity delivered
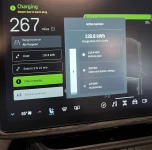
After completing the driving test, I connected the Gravity to my Tesla Wall Connector to recharge from approximately 3% back to 100%.This charger is connected to the Tesla app and reports electrical energy delivered.
I also documented Lucid's own charging display.
Recharge results
| Measurement | Result |
|---|---|
| Starting SOC | 3% |
| Ending SOC | 100% |
| SOC replenished | Approximately 97 percentage points |
| Lucid-reported energy added | 112 kWh |
| Tesla Wall Connector monthly energy recorded | 124.1 kWh |
| Tesla-recorded later charging session | 77.3 kWh |
There was one complication: the Lucid notifications indicate the charging process stopped at approximately 1:17 AM and restarted around 1:24 AM. Tesla's session history consequently displayed a separate later session totaling 77.3 kWh.
I retained screenshots of the cumulative Wall Connector energy readings, including 110.8 kWh earlier in the morning and 124.1 kWh shortly before completion. The 124.1 kWh reading was recorded at 98% SOC; I don't have a separately verified final Wall Connector total after the vehicle reached 100%.
Importantly, the notifications establish that the session was interrupted, but they do not establish whether the cause was the vehicle, charging equipment, adapter, or scheduling behavior.
What the recharge potentially tells us
Lucid reported 112 kWh added when charging completed.If that means energy actually stored in the battery, a simple calculation suggests:
112 kWh ÷ 0.97 = 115.5 kWh of implied usable capacity.
But that is conditional on two things:
- Lucid's 112 kWh figure represents net energy stored in the battery, not energy entering the vehicle before internal losses.
- Displayed SOC is approximately proportional to available battery energy over this interval.
Similarly, comparing Lucid's 112 kWh against Tesla's preliminary 124.1 kWh gives a ratio of about 90.2%.
That seems plausible for AC charging, but I would not call it a definitive charging-efficiency measurement because the final Tesla total is not yet separately verified and the two manufacturers may measure energy differently.
Nevertheless, the recharge data suggest my vehicle may have more available battery energy than the 101.4 kWh displayed on the driving trip computer would initially imply.
That makes understanding the definitions of these energy counters particularly important.
6. Comparison with my previous 2023 Rivian R1S
Before buying the Gravity, I owned a first-generation Rivian R1S Quad-Motor.I performed two similar real-world range experiments with that vehicle in 2023.
Both were multi-day tests using normal commuting and errands.
My Rivian was equipped with 20-inch wheels on smaller all-season tires, the standard size 33" ties.
| Measurement | R1S All-Purpose | R1S Conserve | Gravity GT |
|---|---|---|---|
| Test year | 2023 | 2023 | 2026 |
| Driving mode | All-Purpose | Conserve | Normal daily driving |
| Battery Size | 135 kWh | 135 kWh | 123 kWh |
| EPA Rating at Testing | 328 Miles | 328 Miles | 386 Miles |
| Test duration | 8 days, 9.5 hours | 9 days, 8 hours | ~9 days, 13.5 hours |
| Actual distance | 290.3 mi | 343.3 mi | 327.8 mi |
| Displayed efficiency | 2.50 mi/kWh | 2.93 mi/kWh | 3.23 mi/kWh |
| Ending SOC | 0% | 0% | 3% |
| Full-range projection | 290.3 mi | 343.3 mi | 340.4 mi |
I'm not claiming these are identical or controlled tests. Different vehicles, weather conditions, tire characteristics, and driving patterns can affect the outcomes. Also, manufacturers may calculate displayed efficiency using different methods.
Nevertheless, I find the outcome striking.
My 2023 R1S achieved 343.3 miles in Conserve mode, compared with the Gravity's projected 340.4 miles, despite the Gravity's substantially more aerodynamic design and more advanced electrical architecture.
I also recall the Rivian losing approximately 1% of battery SOC during many overnight parking periods.
By comparison, the Gravity reported only 1.9% parked consumption across the entire nine-and-a-half-day experiment.
That's a genuine positive for Lucid's battery management.
But it makes the ultimate comparison more interesting, because the Gravity enjoyed significantly lower parked consumption during a similarly lengthy test.
I would also love to see Lucid provide a detailed charging-energy breakdown like the one my Rivian offered years ago, showing energy supplied to the battery, battery and cabin conditioning, and accessories.
9. Questions for Lucid engineers or technically knowledgeable owners
After documenting the experiment, these are the questions I'd most appreciate clarification on:- What is the official usable battery capacity of the 123 kWh Gravity GT pack? How much energy is reserved above and below the displayed usable SOC window?
- What exactly does the "Since Last Charge" kWh counter measure? Is it traction-motor energy only, net propulsion energy after regeneration, total energy consumed while driving, or something else?
- What does the Usage screen's 94.4% driving-related battery consumption measure? Why does it differ so substantially from the energy represented by the trip computer's 101.4 kWh figure, assuming approximately 118–120 kWh usable?
- What exactly does Lucid's "112 kWh added" figure represent? Is that energy stored in the battery, energy entering the onboard charger, or another measurement?
- How does Lucid reconcile the trip energy, battery SOC depletion, and charging-energy figures? Are there known differences in accounting, calibration, or unreported auxiliary energy use?
- How were the 386-mile and 407-mile EPA configurations validated? In particular, what explains the seating-configuration difference and the identical published ratings for the two larger wheel configurations?
- Is there a service diagnostic or battery-health measurement that can establish usable pack capacity directly?I'd prefer to assess actual battery health rather than infer it from potentially different energy counters.
10. My overall conclusion
Let me be clear: I don't need 386 miles of range for my daily driving.Even the approximately 340 miles my test projects is more than sufficient for how I use the vehicle.
My interest here is understanding the engineering and verifying how the vehicle performs against its specifications.
Lucid has built its reputation around powertrain efficiency, advanced battery technology, and engineering excellence. Those are precisely the areas where I would expect particularly clear and consistent energy reporting.
I find it disappointing that a 386-mile-rated vehicle, driven gently in a predominantly suburban environment, projected only approximately 340 miles.
But I'm also genuinely interested in understanding why.
The vehicle may be operating entirely as designed, with the discrepancy explained by definitions of usable capacity, auxiliary consumption, and trip-energy accounting.
Alternatively, there may be something about my particular vehicle or its energy reporting that warrants investigation.
I'm not claiming to have demonstrated a battery defect, missing capacity, or an incorrect EPA certification. I'm presenting the measurements and asking how they reconcile.
I have screenshots documenting the test progression, final trip statistics, battery-consumption breakdown, charging results, and Wall Connector energy readings. I use Trip A for my month to month numbers so I reset at the first of the month. Trip B is my lifetime numbers.
I'd especially appreciate input from Lucid engineers, other Gravity owners who have performed similar tests, or anyone with detailed knowledge of Lucid's battery and energy-reporting architecture.
Hopefully, this information helps other owners better understand their vehicles as well.
Thanks for reading!
Attachments
Last edited:


 I am not sure why you guys so obsessed with range