
You are using an out of date browser. It may not display this or other websites correctly.
You should upgrade or use an alternative browser.
You should upgrade or use an alternative browser.
Is Lucid nerfing power output?
- Thread starter legacy
- Start date
Can your app do that? I will drop it in the chart. I couldn’t figure it out from the initial data points.To make chart consistent maybe do 0-130 in 10mph increments since we do have the data for it.
Noted on the 60ft speed
- Joined
- Nov 11, 2024
- Messages
- 1,297
- Reaction score
- 1,324
- Cars
- Gravity GT, Linc Aviator
Uh, maths?Can your app do that? I will drop it in the chart. I couldn’t figure it out from the initial data points.
You know how long it takes to get to 90…and the total 0-100…subtract known 90 data to get the 90-100? And on and on
Maths cannot figure out the even increments below 70 MPH. The data aren’t there. (I already did that from 90 up.)Uh, maths?
You know how long it takes to get to 90…and the total 0-100…subtract known 90 data to get the 90-100? And on and on

- Joined
- Nov 9, 2025
- Messages
- 784
- Reaction score
- 1,219
- Cars
- Model X, XC90, S4, LS460
- Air DE Number
- 1
- Gravity DE Number
- 160
- Referral Code
- 34DTL9L0
The maximum G’s at the limit of traction will not be equal for breaking and acceleration, even with infinite torque. In general, G’s will always be highest for breaking and lower for acceleration.Yeah, it is pretty easy to tell that the Gravity's acceleration limitation is not the tires. Car and Driver tested the 70-0 braking at 163 feet. That is about 1 g deceleration force - a good proxy for the straight-ahead traction limit of the tires. A 0-60 acceleration run in 3.2 seconds is around 0.86g. Well below the tire's grip limit.
This is due to the physics of weight transfer, car balance, tire physics, and aerodynamic drag. For example imagine infinite torque on a FWD versus a RWD vehicle. The RWD vehicle will always produce more G’s as the usable grip increases on the rear wheels and decreases on the front wheels during acceleration. Also, aerodynamics adds to breaking G’s while subtracting from acceleration G’s.
This is kind of both a strawman and a non sequitur. We are talking about AWD cars here, so the comments about RWD are irrelevant. And we are not talking exact match, but maximum braking very much informs the limits of acceleration with regard to traction. The tire does not care if it is going forward or backwards, slowing or speeding. Weight transfer occurs both during acceleration and braking. It is not exactly the same, but normalizes at a high-level. The coefficient of friction is the coefficient of friction. When you see a significant gap between forward acceleration and lateral acceleration and braking, you can discern that traction is not the limiter for straight ahead acceleration.The maximum G’s at the limit of traction will not be equal for breaking and acceleration, even with infinite torque. In general, G’s will always be highest for breaking and lower for acceleration.
This is due to the physics of weight transfer, car balance, tire physics, and aerodynamic drag. For example imagine infinite torque on a FWD versus a RWD vehicle. The RWD vehicle will always produce more G’s as the usable grip increases on the rear wheels and decreases on the front wheels during acceleration. Also, aerodynamics adds to breaking G’s while subtracting from acceleration G’s.
You did see that lateral acceleration exceeds forward acceleration right? Does weight transfer and aerodynamics affect that relative to forward acceleration? Tire traction is not the limitation here.
There are no guesses or interpolation from the drag data presented a few posts above and the chart. Here is what it looks like with Excel's line smoothing switched off. We do need more data points in the lower speed ranges, ideally we would have 5 MPH increments until around 50 MPH. The first data point excludes rollout, so that artificially inflates the calculated rate of acceleration, because it does not begin at 0 MPH. So, a 0-5 MPH data point would separate the rollout error from the later data points. Then, we would see more of a flat line in the chart until around 50 MPH. Instead, just two data points illustrate that. But the six data points above 50 MPH very much show a linear decline in acceleration, as expected with electric motors.The acceleration isn’t linear
Any guess beyond one between two data points starts getting more error prone
And with finite points it gets harder to justify a smooth curve
IMHO
Last edited:
- Joined
- Nov 11, 2024
- Messages
- 1,297
- Reaction score
- 1,324
- Cars
- Gravity GT, Linc Aviator
The weight distribution on the tire front to back is not the same.This is kind of both a strawman and a non sequitur. We are talking about AWD cars here, so the comments about RWD are irrelevant. And we are not talking exact match, but maximum braking very much informs the limits of acceleration with regard to traction. The tire does not care if it is going forward or backwards, slowing or speeding. Weight transfer occurs both during acceleration and braking. It is not exactly the same, but normalizes at a high-level. The coefficient of friction is the coefficient of friction. When you see a significant gap between forward acceleration and lateral acceleration and braking, you can discern that traction is not the limiter for straight ahead acceleration.
You did see that lateral acceleration exceeds forward acceleration right? Does weight transfer and aerodynamics affect that relative to forward acceleration? Tire traction is not the limitation here.
There are no guesses or interpolation from the drag data presented a few posts above and the chart. Here is what it looks like with Excel's line smoothing switched off. We do need more data points in the lower speed ranges, ideally we would have 5 MPH increments until around 50 MPH. The first data point excludes rollout, so that artificially inflates the calculated rate of acceleration, because it does not begin at 0 MPH. So, a 0-5 MPH data point would separate the rollout error from the later data points. Then, we would see more of a flat line in the chart until around 50 MPH. Instead, just two data points illustrate that. But the six data points above 50 MPH very much show a linear decline in acceleration, as expected with electric motors.
View attachment 40065
The power distribution at vehicle launch is also not the same due to 600+228 motors rear to front.
Not sure we are getting to a result arguing the tire point.
Based on what other vehicles with similar power ratings can do at launch we can safely assume Lucid is limiting launch power to benefit higher speed acceleration. Or maybe they just decided to keep it civil for family use. Either way, it’s not a tire limitation specifically but possibly a combination of purpose and driveability.
Yeah, the point of the tire sidebar is to illustrate that tire traction is probably not the limitation. But, I don't think we have enough data to make a judgement on whether they actually are limiting launch power, the acceleration data you posted above seems to follow a predicted pattern of normal electric motors. They do have to limit torque "jerk" at launch, but after that, we do not have sufficient data to know if they are limiting max torque.The weight distribution on the tire front to back is not the same.
The power distribution at vehicle launch is also not the same due to 600+228 motors rear to front.
Not sure we are getting to a result arguing the tire point.
Based on what other vehicles with similar power ratings can do at launch we can safely assume Lucid is limiting launch power to benefit higher speed acceleration. Or maybe they just decided to keep it civil for family use. Either way, it’s not a tire limitation specifically but possibly a combination of purpose and driveability.
When you say "other vehicles with similar power ratings," which cars are you thinking of? I can do some quick physics comparisons. The math is simple: Acceleration is simply force at the wheels divided by vehicle mass. (Not exact, but directionally.) Then, force at the wheels is a motor max torque multiplied by transmission ratio and divided by wheel diameter. There are other factors, but that pretty much distills it down. (Ironically, horsepower does not play a material role in informing electric vehicle acceleration.)
Can your app dump 5 MPH splits from 0 to 130? If so, please share, and I will chart them.
Also, here are a few more fun comparisons that show relative rates of acceleration between road car specifically designed to be very fast. It has been a while since I looked at this, and I was surprised to see how much higher acceleration rates are versus braking.
- Joined
- Nov 11, 2024
- Messages
- 1,297
- Reaction score
- 1,324
- Cars
- Gravity GT, Linc Aviator
Rivian R1S tri motor is a direct competitor to GT for power and it is much heavier yet 0-60 is faster. There are others with very strong 0-60 which fizzle out by the quarter.
The app can definitely do 5mph splits if I ask it, I just have to punch it in and then go find a spot to hit 130…not super easy being in Manhattan.
The app can definitely do 5mph splits if I ask it, I just have to punch it in and then go find a spot to hit 130…not super easy being in Manhattan.
- Joined
- Feb 15, 2026
- Messages
- 46
- Reaction score
- 43
- Cars
- 2026 Gravity GT
My feeling is that they tuned throttle for a more "natural" or ICE-like build up of power, which reviewers note. Either that or to protect driveline components. Would be nice if they gave us a mode with just the raw output.
That is a great comparison example... The reason that the Rivian is so much faster is that it has both a lot more torque and a much higher transmission ratio. The result is what you describe: ripping fast early on and then fizzle out later. At the line, the Rivian has a 62% torque advantage against a 12% mass disadvantage. I would expect it to accelerate hella fast initially.Rivian R1S tri motor is a direct competitor to GT for power and it is much heavier yet 0-60 is faster. There are others with very strong 0-60 which fizzle out by the quarter.
The app can definitely do 5mph splits if I ask it, I just have to punch it in and then go find a spot to hit 130…not super easy being in Manhattan.
- Joined
- Nov 11, 2024
- Messages
- 1,297
- Reaction score
- 1,324
- Cars
- Gravity GT, Linc Aviator
Tri-Motor is listed at 2.8 seconds by Car and Driver, Cyber Truck beast is at 2.6 to 60. Similar power to GT.That is a great comparison example... The reason that the Rivian is so much faster is that it has both a lot more torque and a much higher transmission ratio. The result is what you describe: ripping fast early on and then fizzle out later. At the line, the Rivian has a 62% torque advantage against a 12% mass disadvantage. I would expect it to accelerate hella fast initially.
View attachment 40068
Attachments
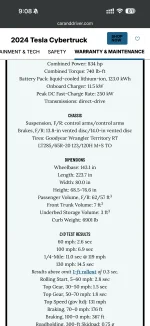
That is another great one and an illustration of how automakers can engineer a car to excel in certain metrics with some other sacrifices. In the Cyberbeast's case, it uses a really high transmission ratio against relatively low torque. This gives it a major torque advantage at the line. And like the Rivian, it will fizzle out because of the high transmission ratio.Tri-Motor is listed at 2.8 seconds by Car and Driver, Cyber Truck beast is at 2.6 to 60. Similar power to GT.
Compared to the Gravity GT, the Cyberbeast has an 82% torque advantage against a 14% mass disadvantage. So yeah, this should accelerate a whole lot faster than the Gravity. And it also explains why the Cybertruck is even a little quicker than the R1S Tri Motor despite its lower torque.
- Joined
- Nov 11, 2024
- Messages
- 1,297
- Reaction score
- 1,324
- Cars
- Gravity GT, Linc Aviator
Cyber truck beast hits the quarter mile same time as GT while doing 10mph less, it was certainly optimized for the 1/4 mile bragging rights. Gravity has a higher top speed but not many brag about going 156 vs 130…Rivian maxes out at 120 outside launch mode where it can hit 130…that’s a bit of a joke.That is another great one and an illustration of how automakers can engineer a car to excel in certain metrics with some other sacrifices. In the Cyberbeast's case, it uses a really high transmission ratio against relatively low torque. This gives it a major torque advantage at the line. And like the Rivian, it will fizzle out because of the high transmission ratio.
Compared to the Gravity GT, the Cyberbeast has an 82% torque advantage against a 14% mass disadvantage. So yeah, this should accelerate a whole lot faster than the Gravity. And it also explains why the Cybertruck is even a little quicker than the R1S Tri Motor despite its lower torque.
View attachment 40070
Yep, they clearly optimized for the sizzle.Cyber truck beast hits the quarter mile same time as GT while doing 10mph less, it was certainly optimized for the 1/4 mile bragging rights. Gravity has a higher top speed but not many brag about going 156 vs 130…Rivian maxes out at 120 outside launch mode where it can hit 130…that’s a bit of a joke.
- Joined
- Nov 11, 2024
- Messages
- 1,297
- Reaction score
- 1,324
- Cars
- Gravity GT, Linc Aviator
Embarrassing acceleration is literally their #1 selling point, efficiency, dynamics, handling, packaging…that’s all well behind the acceleration which is what attracted people to their EV vehicles.Yep, they clearly optimized for the sizzle.
Exactly. Rivian copied that a little, but their R1S is not nearly as badly sub-optimized compared to the Cyberbeast.Embarrassing acceleration is literally their #1 selling point, efficiency, dynamics, handling, packaging…that’s all well behind the acceleration which is what attracted people to their EV vehicles.
The major metric to look for, and others have repeatedly commend on, is the 50-70 acceleration split. This is at or after the point when most electric motors start losing torque. The higher the gear ratio, the lower the speed at which acceleration will fall off. So, the Gravity DE does 1.5 seconds from 50-70. On the other hand, the Cyberbeast does 1.8 seconds and the R1S Tri Motor does 2.1 seconds. In routine highway driving, when you want to ease past someone, the Gravity will smoke the other two. That is when it matters in everyday life.
Lucid achieved this by playing the long game. First, they used a lower transmission ratio that extends the range of max torque. Then, they optimized the motors to have a higher field weakening RPM point (on the faster Gravity variants), which further extends the range of max torque. Those two give it way better higher speed acceleration capabilities. The trade-off is lower torque off the line, which reduces its lower speed acceleration splits.
Hahaha, yep. If you dropped 10:1 transmissions in the Gravity GT, it would easily go sub-3.Sooo basically if we do a gear swap, we can hit 2'sgood to know at least!
Last edited:
In both acceleration and efficiency.Hahaha, yep. If you dropped 10:1 transmissions in the Gravity GT, it would easily go sub-3.