And/or understandable FEAR!That is will power, my friend - pure, unadulterated will power!

And/or understandable FEAR!That is will power, my friend - pure, unadulterated will power!
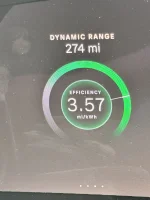
I haven’t been able to figure out the relationship between dynamic range and trip meter, either.I’ve always disregarded the dynamic range and efficiency on the left display. It is very labile and reflects some combination of ongoing and recent historical driving patterns. But it is ALWAYS much lower than the Trip efficiency I see.
How do you all interpret dynamic range and efficiency numbers?
I agree the project SOC at destination is quite accurate. Not sure how dynamic range influences that graph. If you have more data definitely share in new thread!I haven’t been able to figure out the relationship between dynamic range and trip meter, either.
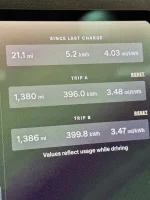
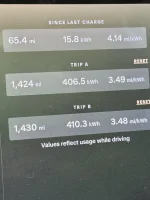
Here is the confusing part. Navigation SOC on arrival is accurate, and it’s very nice that it takes into account elevation changes along the route. In the charge graphs (charge -> usage -> since-charge/last-route), I almost always get less than 1% deviation between estimated (white line) and actual (green line) SOC on arrival. However the trip meter can be over 20% off of the dynamic range/efficiency dial. I haven’t been able to reconcile the difference.
I’ll start a new thread with pics and data instead of hijacking this one.
What kind of speeds were you driving?4 miles / kwh is achievable
Over 21 miles...sure4 miles / kwh is achievable
the 3,5kwh on your screenshot to what real range will that lead?!4 miles / kwh is achievable

What wheels do you have? I'm getting 2.49 with my 23'sNew Record with same driving patterns higher temp

What total range would that be then?New Record with same driving patterns higher temp
Oh maybe it's because of the 23z... I guess 20/21 should be the option for best range...not sure if 23 is so much better lookingWhat wheels do you have? I'm getting 2.49 with my 23's