
- Joined
- Sep 30, 2025
- Messages
- 507
- Reaction score
- 555
- Location
- Silicon Valley adjacent
- Cars
- Gravity GT
- Referral Code
- CA8VVCF7
State of Charge has a new video out on their perspective of the Eastern Edge race. I grabbed this screenshot from a 400kW EA charger:
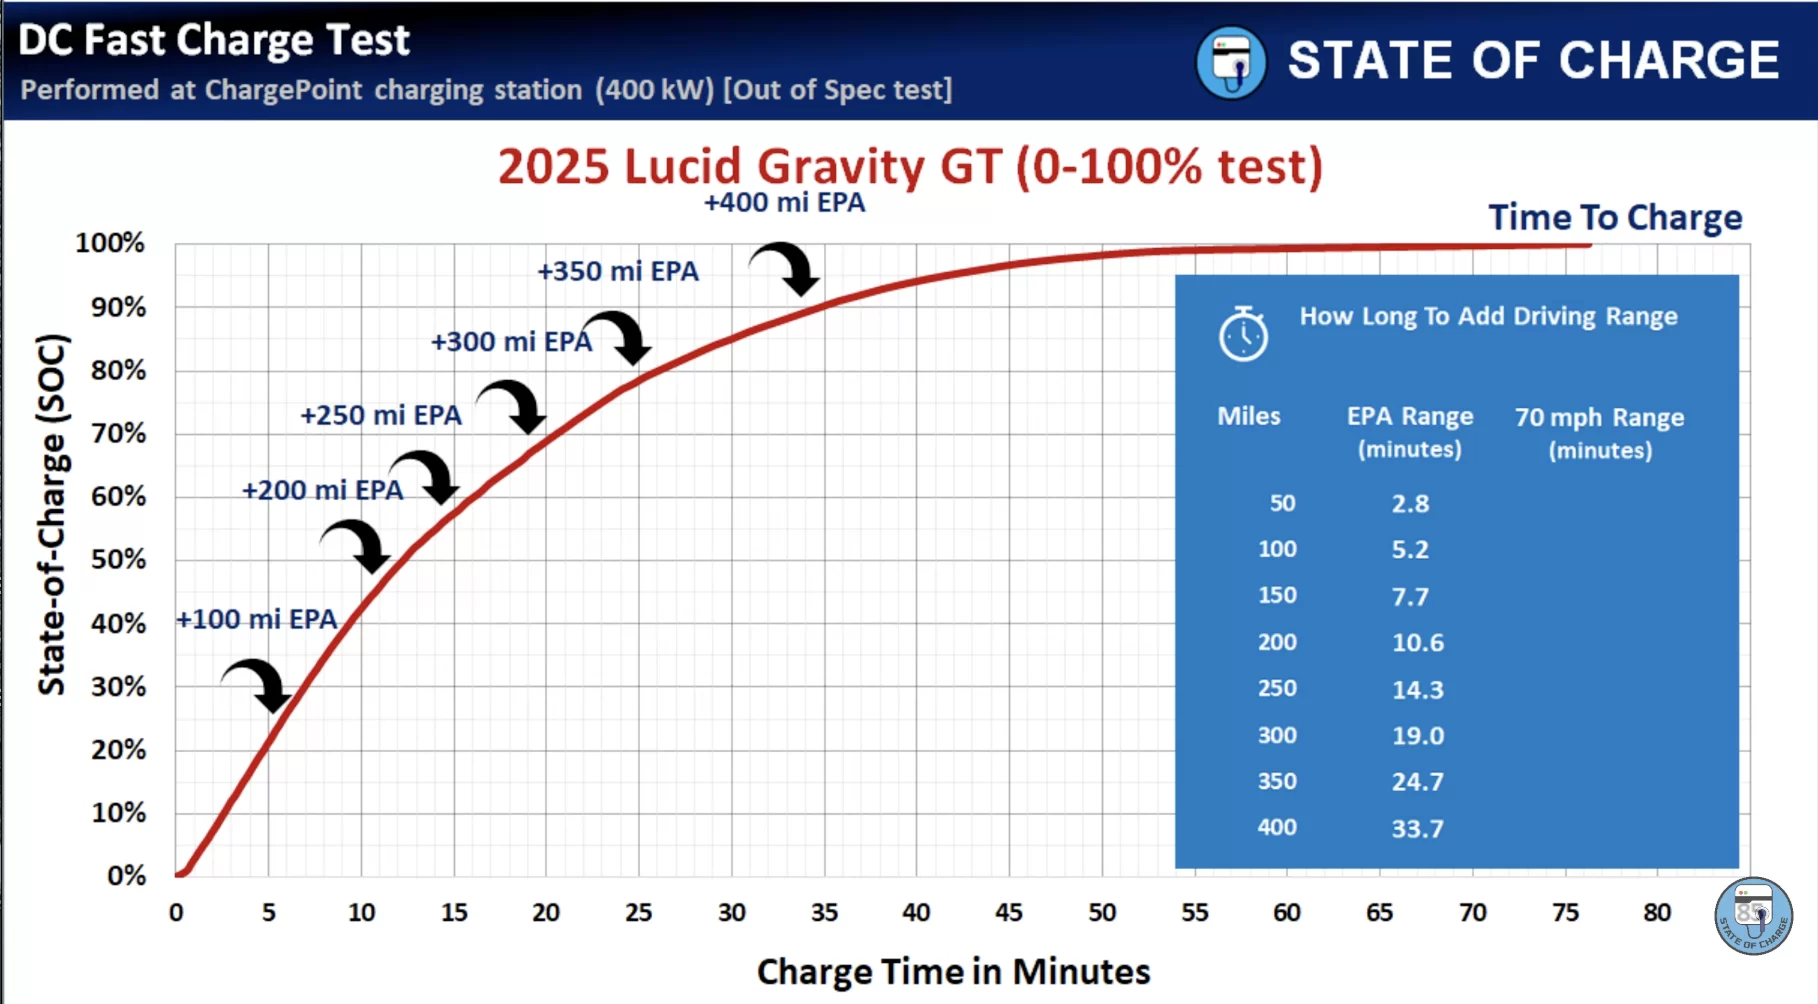
He did it cumulatively, but I was more interested in incremental, so:
I was interested in finding the optimum point to stop charging and go to the next charger. Obviously, while the charging rate slows down (as much as a factor of 3.75!), the time from off-ramp to on-ramp also matters (time to get to charger, park, get out of car, plug, get the handshake going until actual start, then the small ramp-up time as the charger modules kick-on), then un-plug, get back in car, and drive to the on-ramp (including traffic lights both ways).
Let's say the ideal starting charge is below 10%, but above 0% (you can go lower due to the buffer), and choose a 2.9 seconds/mile number. At 56% (Tom's ideal stopping charge), you need 5.64 seconds to get a mile. That's 2.74 additional seconds/mile to keep charging instead. If we want to go from 11 stops on the Eastern Edge Race to 10 stops, well, let's look at the data:
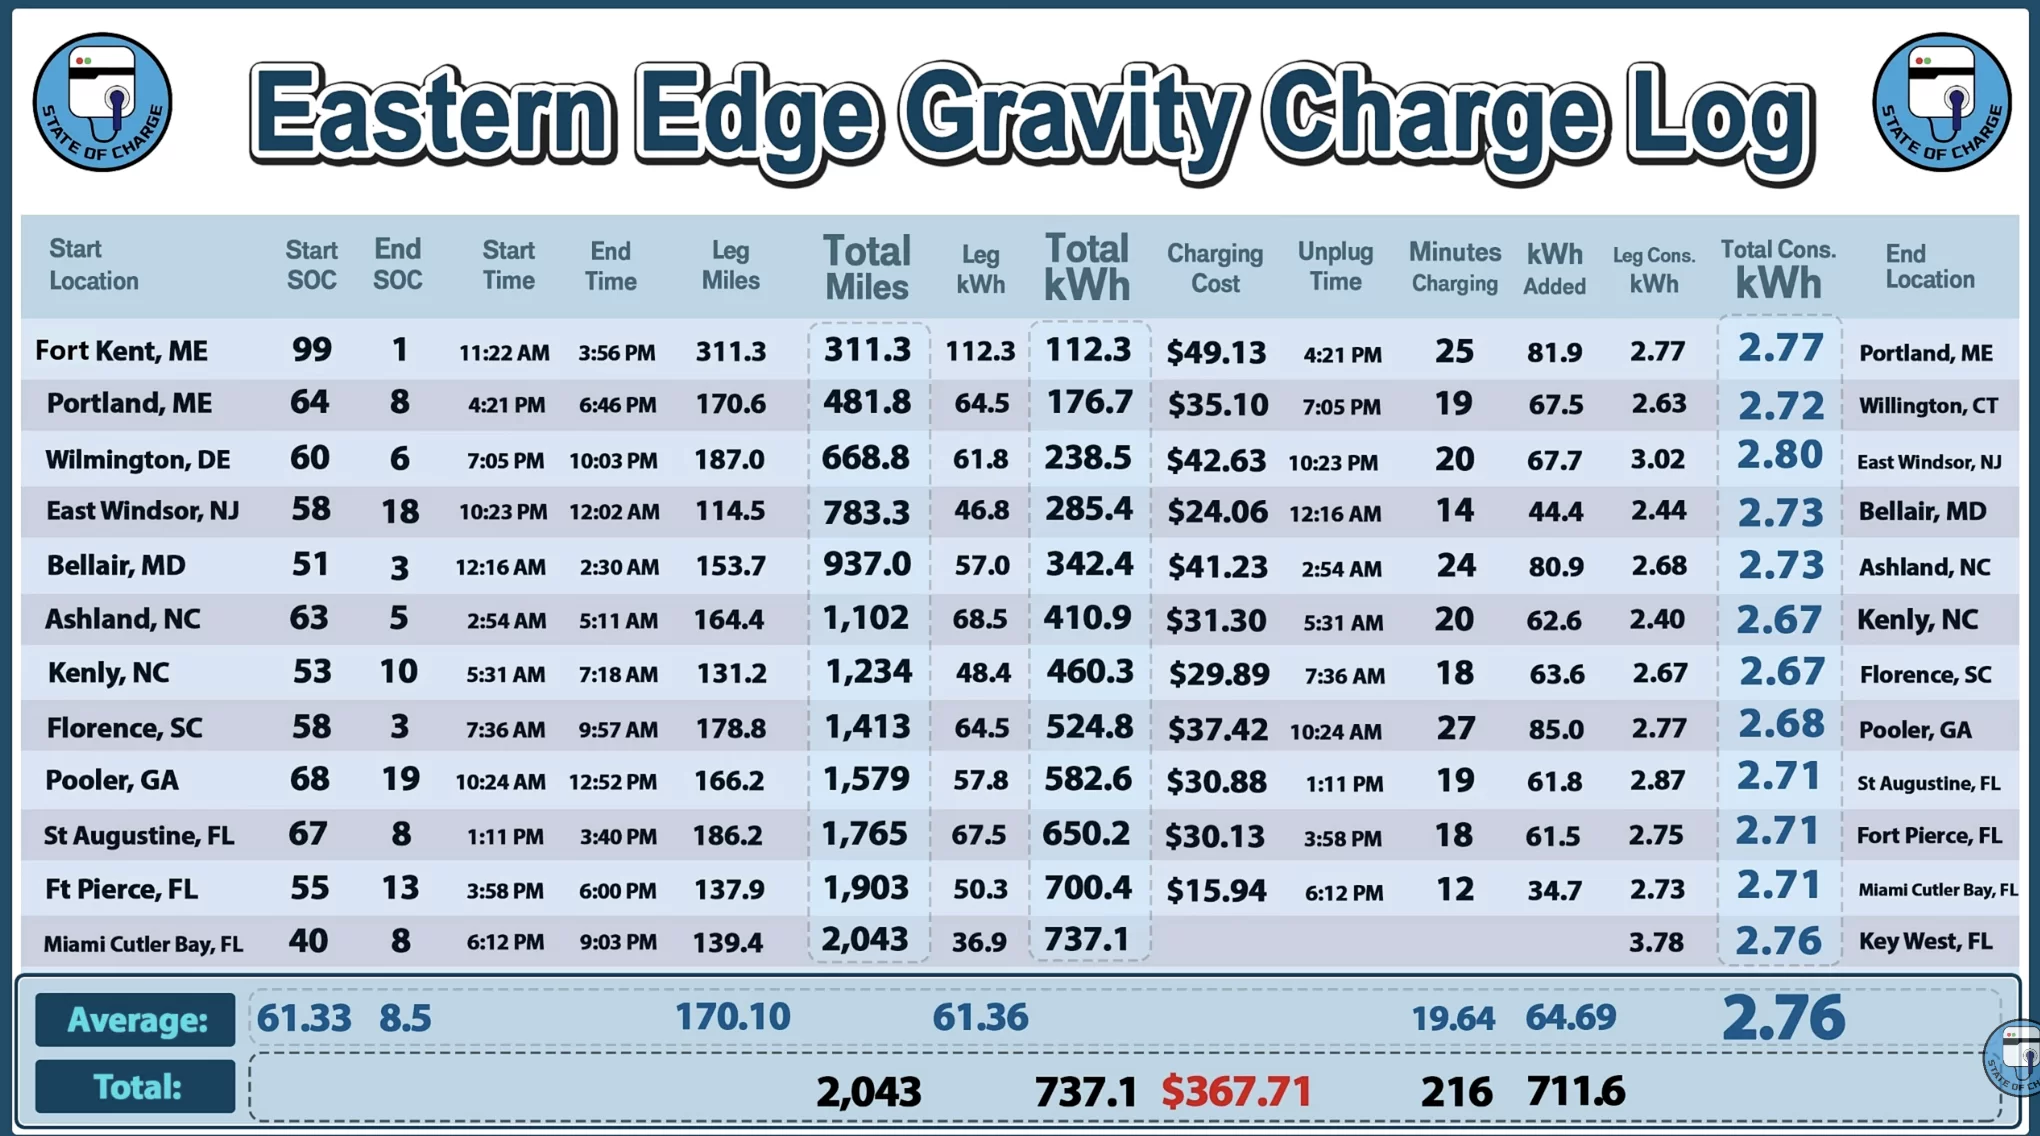
First charge doesn't count for on-road charging, so they added 624.8 kWh on each of 11 stops. If we wanted to do 10 stops instead, that would mean adding, on average, 62.4kWh per stop instead of the about 57kWh per stop they actually did. That's a difference of about 5.4 kWh additional. At 2.7 miles/kWh, that's 14.6 additional miles needed.
Tom shows a chart and decided that 57% SOC was the ideal stopping point - and they came close to averaging that. At 57% SOC, staying on for 5.4kWh would add (14.6miles*5.64seconds/mile) 82.3 seconds per stop. Times 10 stops and that's 13.725 minutes. So, if they could do their stops with an average down time of less than 13.725 minutes, then Tom was right.
But, especially since his team was restricted to 225kW chargers (Tesla SCs), maybe the stopping SOC was even earlier. Look at how well Model X did with lots and lots of stops. It would be interesting to run this calculation the other way and see if SC Gravity maybe should have done even more stops to save some time.
He did it cumulatively, but I was more interested in incremental, so:
| Starting SOC (approx.) | Time to add 50 EPA Miles | Avg Time Per Mile |
| 0% | 168 seconds | 3.36 seconds/mile |
| 11.1% | 144 seconds | 2.88 seconds/mile |
| 22.2% | 150 seconds | 3.0 seconds/mile |
| 33.3% | 174 seconds | 3.48 seconds/mile |
| 44.4% | 222 seconds | 4.44 seconds/mile |
| 55.6% | 282 seconds | 5.64 seconds/mile |
| 66.7% | 342 seconds | 6.84 seconds/mile |
| 77.8% | 540 seconds | 10.8 seconds/mile |
I was interested in finding the optimum point to stop charging and go to the next charger. Obviously, while the charging rate slows down (as much as a factor of 3.75!), the time from off-ramp to on-ramp also matters (time to get to charger, park, get out of car, plug, get the handshake going until actual start, then the small ramp-up time as the charger modules kick-on), then un-plug, get back in car, and drive to the on-ramp (including traffic lights both ways).
Let's say the ideal starting charge is below 10%, but above 0% (you can go lower due to the buffer), and choose a 2.9 seconds/mile number. At 56% (Tom's ideal stopping charge), you need 5.64 seconds to get a mile. That's 2.74 additional seconds/mile to keep charging instead. If we want to go from 11 stops on the Eastern Edge Race to 10 stops, well, let's look at the data:
First charge doesn't count for on-road charging, so they added 624.8 kWh on each of 11 stops. If we wanted to do 10 stops instead, that would mean adding, on average, 62.4kWh per stop instead of the about 57kWh per stop they actually did. That's a difference of about 5.4 kWh additional. At 2.7 miles/kWh, that's 14.6 additional miles needed.
Tom shows a chart and decided that 57% SOC was the ideal stopping point - and they came close to averaging that. At 57% SOC, staying on for 5.4kWh would add (14.6miles*5.64seconds/mile) 82.3 seconds per stop. Times 10 stops and that's 13.725 minutes. So, if they could do their stops with an average down time of less than 13.725 minutes, then Tom was right.
But, especially since his team was restricted to 225kW chargers (Tesla SCs), maybe the stopping SOC was even earlier. Look at how well Model X did with lots and lots of stops. It would be interesting to run this calculation the other way and see if SC Gravity maybe should have done even more stops to save some time.
